Below is my most important decision-making spreadsheet, as it breaks down each pair of starting pitchers from a day’s schedule of games. This is the spreadsheet from which my MLB picks – usually over/under run totals – are derived.
This is also the sheet that produced a 53% winning percentage in over/under plays since its launch on 6/30/17!
The spreadsheet is separated into three categories: pitcher, opponent, and run environment. Each of these sets of numbers includes complex calculations going on in the background – offline – and is presented on a scale of 0-100 – 100 representing the best position for that pitcher. In the end, these three factors are put into a weighted average calculation and produces the overall pitcher rating for the day. These pitchers are then ranked against one another in the second-to-last column – 1 representing the best pitcher matchup of the day. Of course, bullpens have an impact on the final score regularly, but it is the starting pitcher who makes-or-breaks a team’s initial chances.
Finally, my own ranking is compared to the ranking of each team’s odds, derived using “implied runs.” Make no mistake about it, using implied runs – basically, combining odds for a team to win with its projected run total – is incredibly flawed. In fact, it will almost certainly lead to the wrong conclusion. This will undoubtedly be a discussion for another time, but stop thinking of implied runs as a barometer for a team and, instead, use it as a comparison tool.
There are a few examples of the best practices for reading this spreadsheet below, but the following “cutoff” points have proven to be most successful:
– Both pitchers in a game have ratings of 55 or higher – target the “Under”
– One pitcher hovers around the 45 rating while the other sits around 35 – target the “Over” – Run total numbers tend to be naturally inflated by a number of factors, and we really want to pick against pitchers who are expected to 1) pitch below average and 2) pitch worse than the odds suggest. By finding two pitchers who aren’t horribly bad in the rankings, we usually get more value.
– With less frequently and success, we can target one side of a game – moneyline or runline – only when my rank for a pitcher vastly differs from that of the odds. This happens less often, and usually needs a large imbalance to get my attention.
– By the same reasoning through which we pick our “Over” plays, we will shy away from picking against the worst pairing of pitchers on a given night, especially if the odds agree. In that case, we might actually take the “Under,” since the run total will be simply be too high to be met. Does it involve risk? Yes. But does it work? More times than common sense would suggest. So, if both pitchers have ratings under 35 – or just represent the worst pairing of the day – and the run total is high – 9.5 or higher, usually – target the “Under.” Exceptions might be made for games in Colorado, as it might be best to stay away because of the high altitude and the impact it has on a batted ball.
For any game that I particularly like, I will indicate which play I would make in the first column via the following abbreviations: U (Under) or O (Over), RL+ (Runline, only if team is +1.5), RL- (Runline, only if team is -1.5), and ML (Moneyline). As always, please do your own research and make your own decisions about which picks to make. The recent results are found at the top of the spreadsheet.
When using this spreadsheet to form a daily fantasy baseball lineup, the same principles remain intact. If my numbers and the odds show that a pitcher is among the best of the day, he can make it onto our ‘short list.’ Maybe his salary eventually knocks him off, but we can eliminate options ahead of time.
Best of luck with this spreadsheet! If you have any questions, email them to contact@sporfolio.com or find me on Twitter @MarioMergola.
Actual Spreadsheet Example #1 - 5/16/17
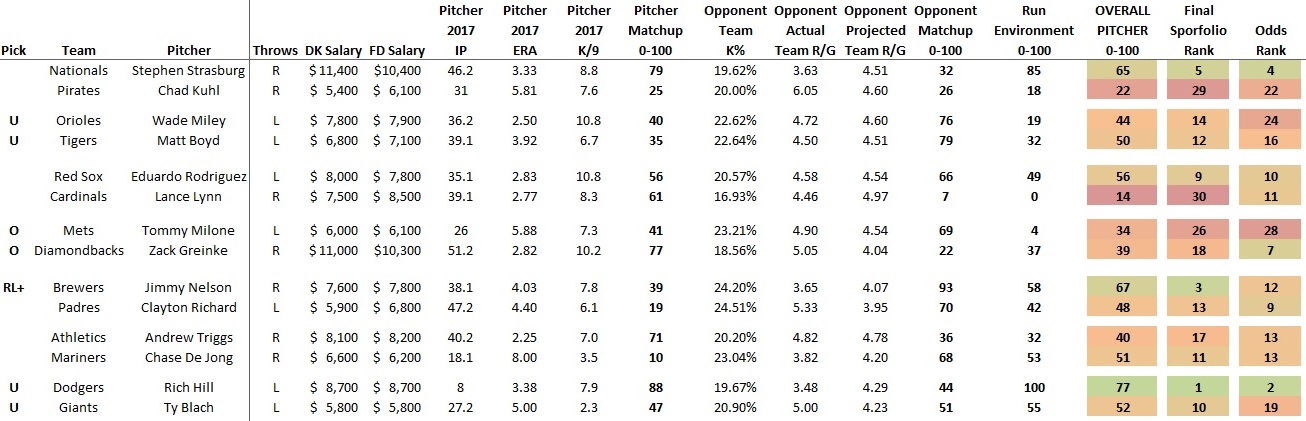
Strasburg is significantly better ranked than Kuhl, but my spreadsheet doesn’t love the Nationals as much as the odds do. Might he dominate? Yes. But, losing a few ratings points to what the odds dictate his grade should be presents a risk I’m not willing to take on a large slate of games.
The pairings of Miley/Boyd and Hill/Blach feature both pitchers beating the odds, some by significant margins. These are the first two games in which I am targeting the “Under.” Conversely, there should be plenty of runs scored in Arizona and, although the run total is high, the odds show there is still some wiggle room – mainly, from Greinke. I would lean toward the “Over.”
The Brewers and Padres have a great setup of reversed ratings between my spreadsheet and the odds. Of course, this can suggest that a ‘trap’ is in the works, but the numbers are clearly pointing in Nelson’s favor. I am going to target the “Runline +1.5,” but with caution. I’d be more comfortable using Nelson in a daily fantasy baseball lineup since my ranking of him far exceeds what the odds show.
Eduardo Rodriguez and the Red Sox don’t particularly have a great edge, but Lance Lynn and the Cardinals appear to be in store for a rough night. Since Rodriguez may not deliver, as well, the best course of action would be to stack hitters against Lynn in a daily fantasy lineup.
Interestingly enough, Andrew Triggs – in the midst of a breakout season – is neither loved by the odds nor my spreadsheet. Especially going against Chase De Jong and his 7.85 ERA, Triggs would figure to have had a better rating somewhere. While there is not much value in picking any side of the game, daily fantasy players can form a ‘contrarian stack’ of the Mariners, especially in night slates – where Triggs is one of the most expensive pitchers.
Final Results: 2-1-1 with picks, Boston and Seattle each scored 6 runs, and Strasburg won, but with a comparatively average performance – 6 IP, 3 ER, 3 K
Actual Spreadsheet Example #2 - 5/22/17
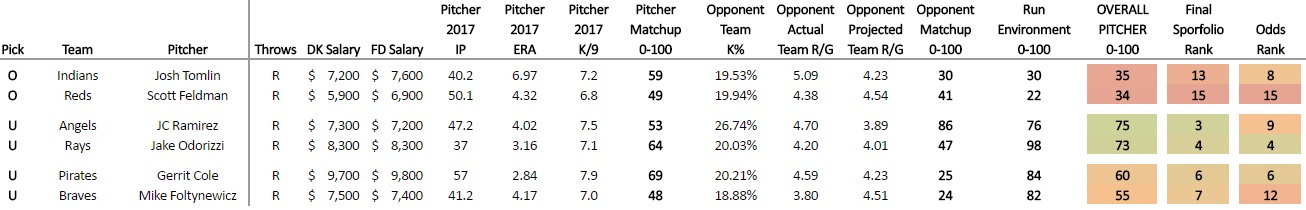
While far from an exact science, here are the “cutoff” points I have been using successfully with respect to starting pitchers and the expected result of their games. I am using Monday, 5/22/17 as my example.
Low-Scoring – Targeting the “Under”
Both starting pitchers must have a rating of a 55 or higher. Of course, the higher, the better, and I would love to see the odds fail to reflect this, but I will usually make a play if both have at least a 55 rating. It is an added bonus when both pitchers are ranked in the top 1/3 of the day’s starting pitchers.
From Monday’s slate: Angels/Rays and Pirates/Braves
High-Scoring – Targeting the “Over”
Of course, this will be the opposite of the low-scoring requirements, but it also a bit more flexible. The “Over” is technically an uncapped result – as teams may never stop scoring – so I tend to want both pitchers to be under a rating of 40. If one pitcher is under 30-35, I may be more forgiving with my requirement of the other.
From Monday’s slate: Indians/Reds
Final Results: 2-1
Actual Spreadsheet Example #3 - 5/23/17
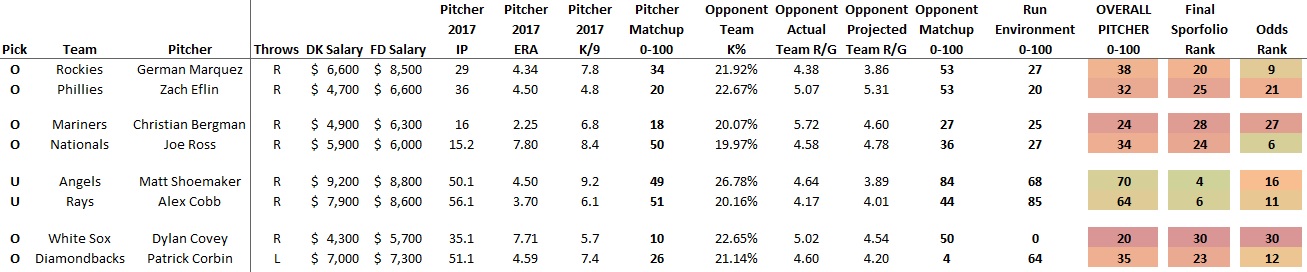
I’m still waiting on a good example of imbalanced odds between two teams – i.e. one team should win or compete, despite the odds disagreeing – but the over/under plays have been consistently successful – 4-1-1 over the last two days. These are the “cutoff” points I have been using, and I will apply them to Tuesday, 5/23/17 as my example.
Low-Scoring – Targeting the “Under”
Both starting pitchers must have a rating of a 55 or higher. Of course, the higher, the better, and I would love to see the odds fail to reflect this, but I will usually make a play if both have at least a 55 rating. It is an added bonus when both pitchers are ranked in the top 1/3 of the day’s starting pitchers.
From Tuesday’s slate: Angels/Rays
High-Scoring – Targeting the “Over”
Of course, this will be the opposite of the low-scoring requirements, but it also a bit more flexible. The “Over” is technically an uncapped result – as teams may never stop scoring – so I tend to want both pitchers to be under a rating of 40. If one pitcher is under 30-35, I may be more forgiving with my requirement of the other.
From Tuesday’s slate: Rockies/Phillies, Mariners/Nationals, and White Sox/Diamondbacks
Final Results: 3-1